I created this dashboard a couple of years ago because of the one time we turned up in Barcelona mid-July and nearly roasted ourselves into crunchy chickens.
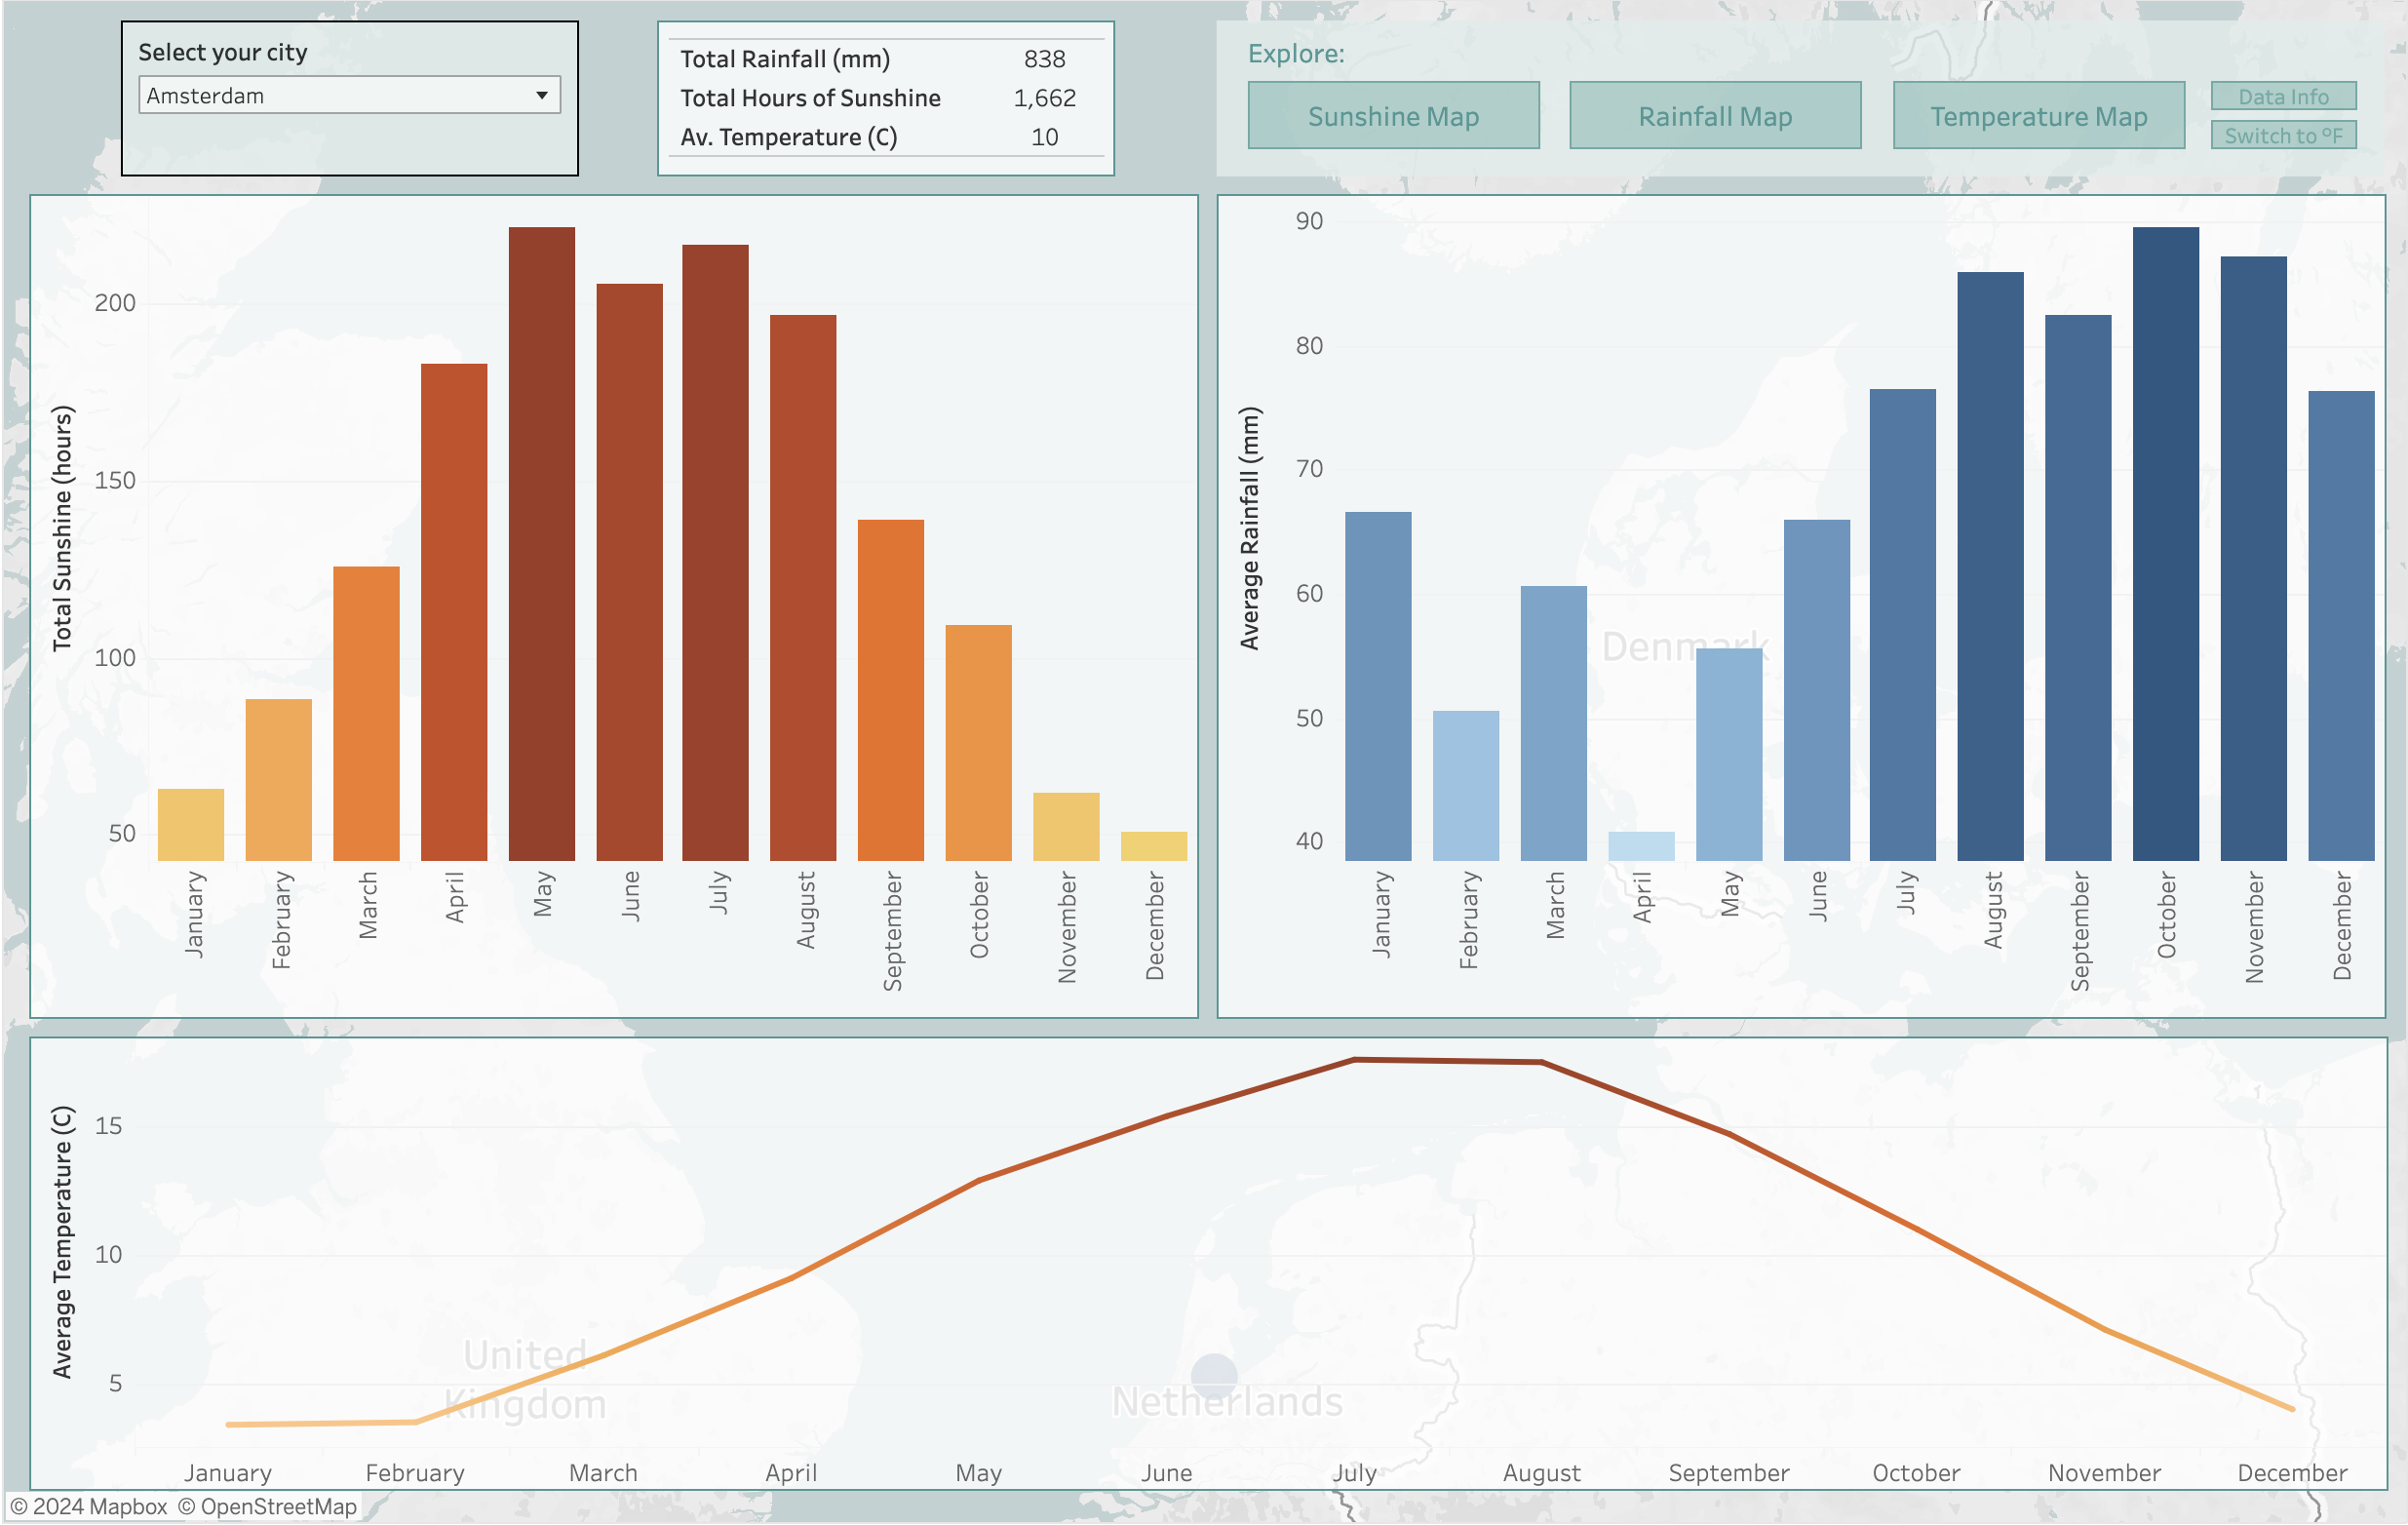
The dashboard includes data of temperature, rainfall and sunshine hours by city and month! Honestly, it’s nothing fancy but it has been so incredibly useful to pick where to go during what time of the year. I have some plans to add an additional view where we can compare two places to each other (but who has the time 😅).

The dashboard itself is broken down by month. On the primary view (above) you can select the city (though there is a limited amount of cities available to pick from) and it shows the temp (in F or C), rainfall and sunshine hours for the selected month.

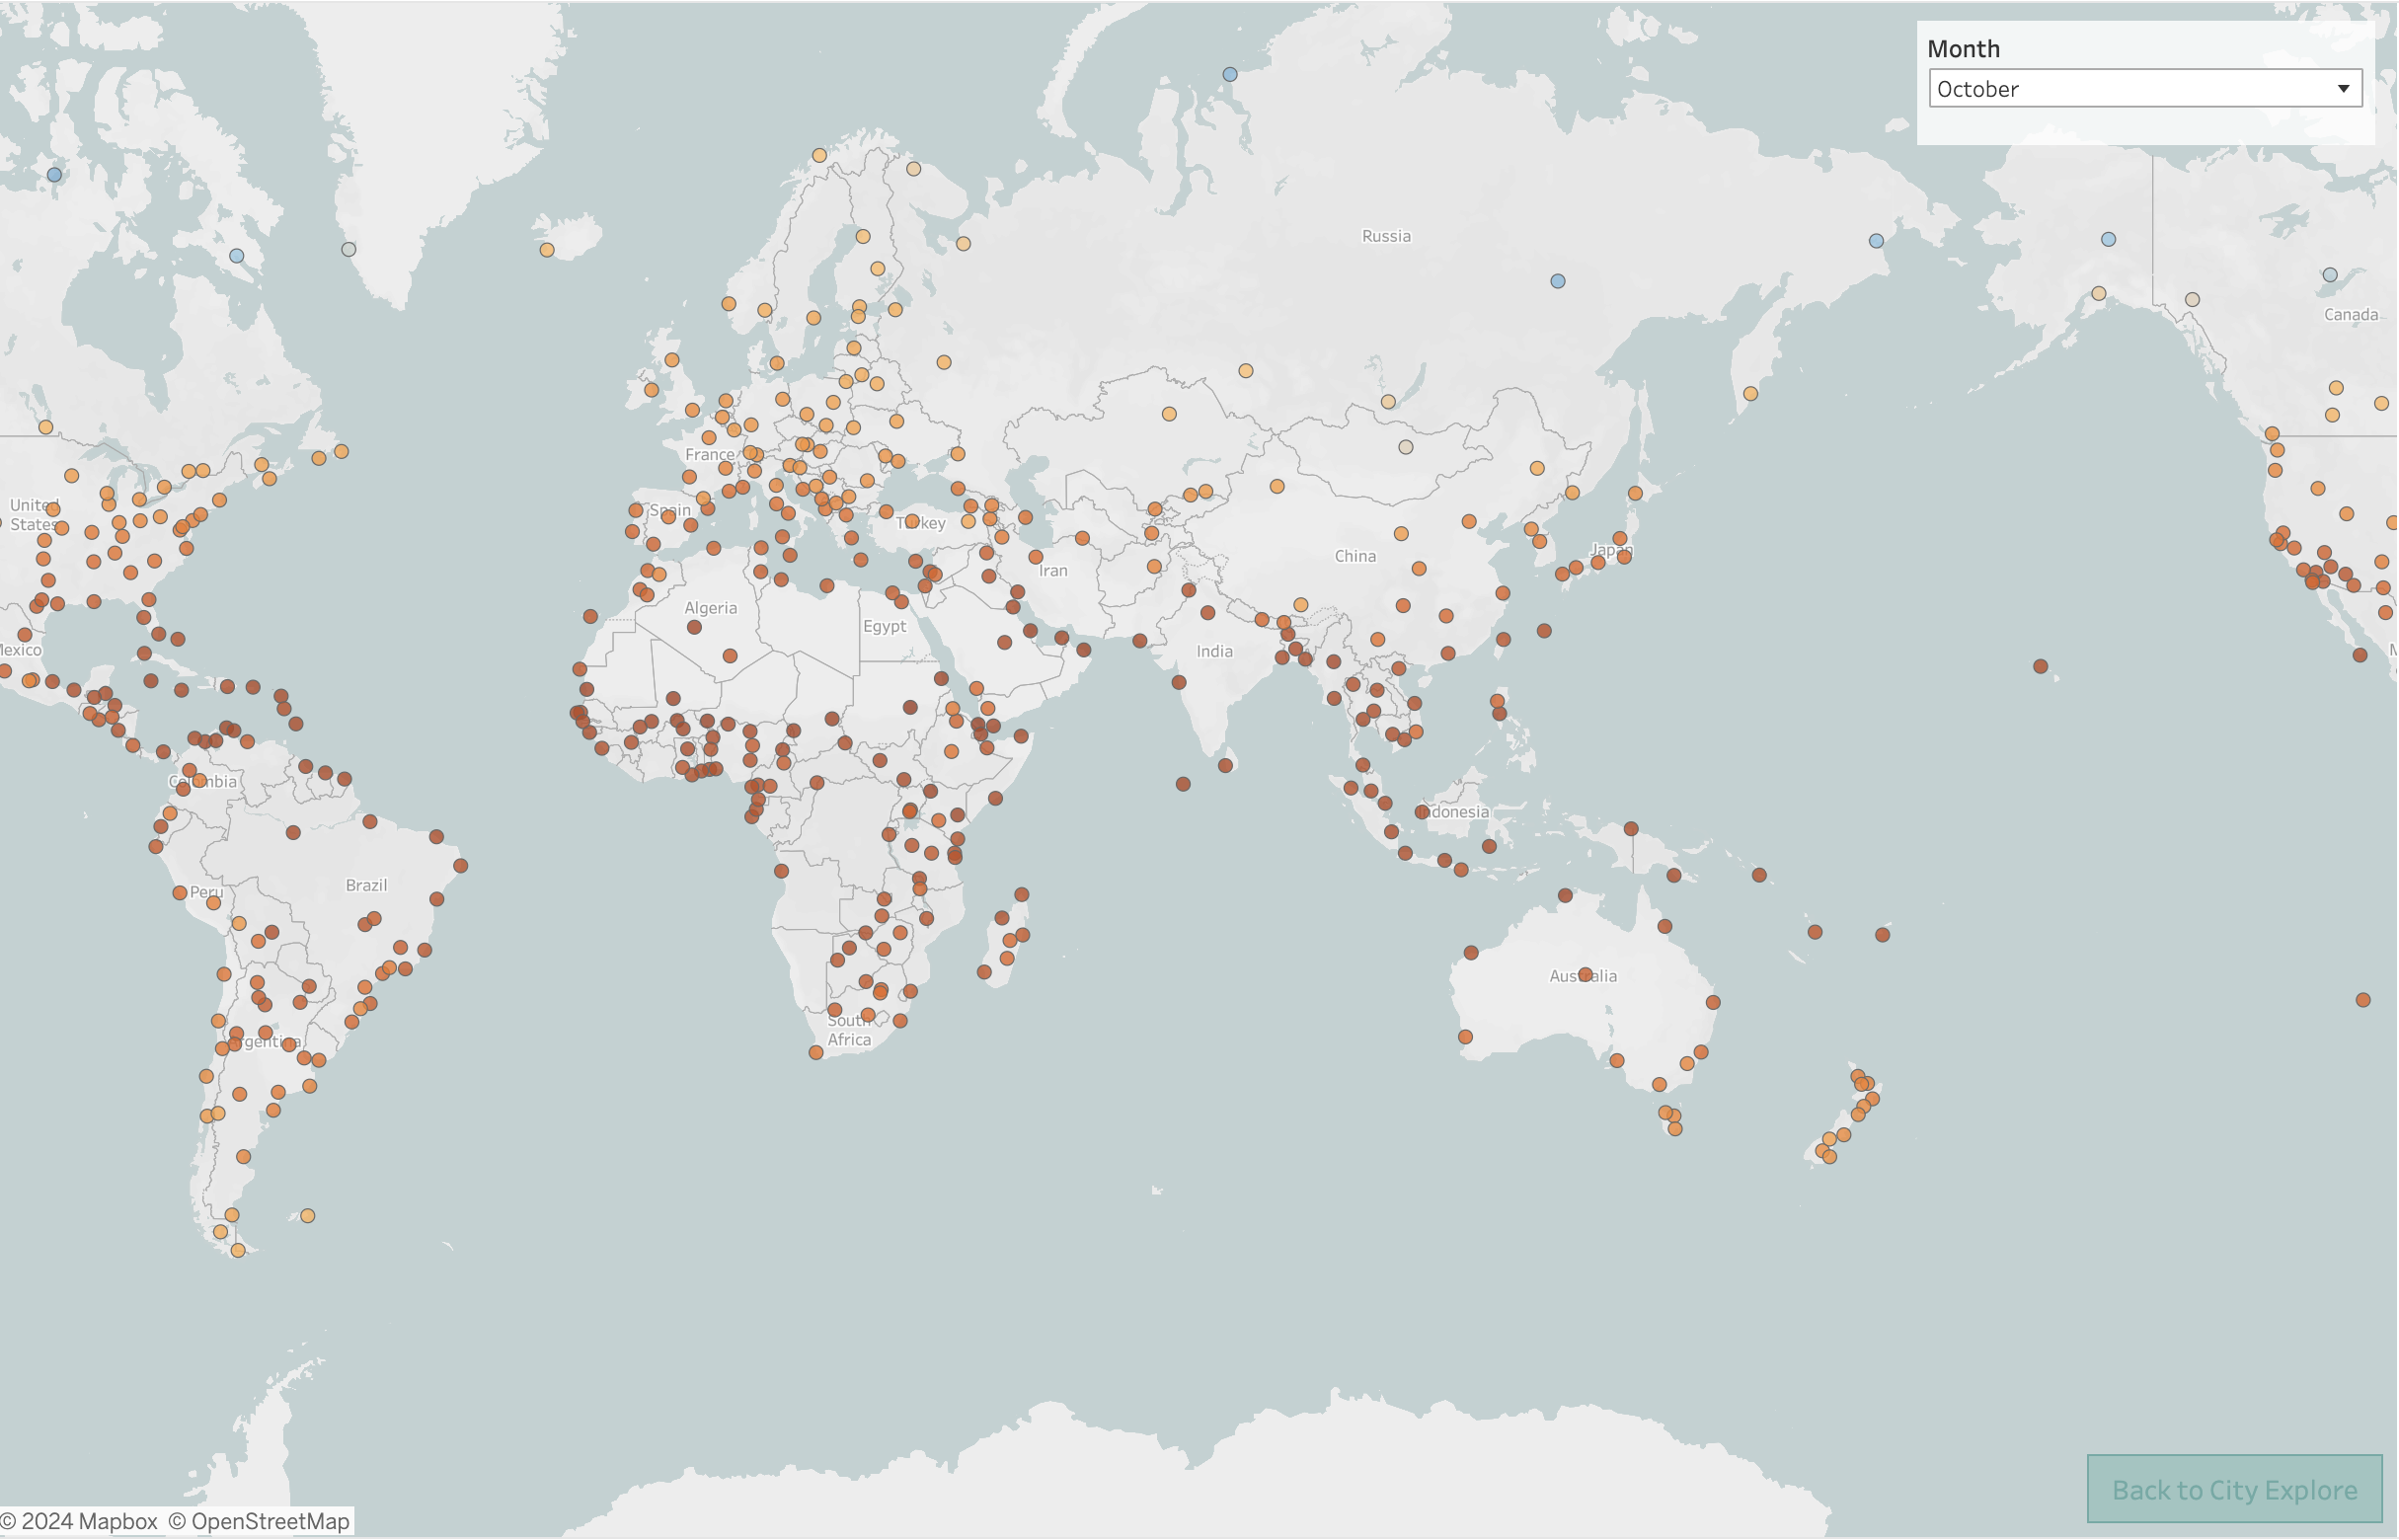
The temperature, rainfall and sunshine hour maps (above) are gradient-coded and you can hover over the cities to see the weather values.
I took the climate data from different wikipedia pages and the coordinates from a public dataset, joined them in bigquery and plopped the output into the dashboard.
